
Many B2B sales teams obsess over LinkedIn likes and follower counts whilst missing the analytics goldmine beneath. These vanity metrics rarely translate into qualified leads or closed deals. Engagement metrics like click-through rates can increase qualified leads by up to 30% when optimised based on analytics insights. This article reveals which LinkedIn analytics truly matter for UK SMEs, how to interpret them strategically, and practical frameworks for turning data into measurable sales growth.
Table of Contents
- Introduction To LinkedIn Analytics For B2B Sales
- Key LinkedIn Analytics Metrics For B2B Lead Generation
- Common Misconceptions About LinkedIn Analytics
- Framework For Leveraging LinkedIn Analytics Insights
- Real-World Examples: LinkedIn Analytics Driving Sales Growth
- Practical Tips For Optimising LinkedIn Sales Performance Using Analytics
- Frequently Asked Questions About The Role Of LinkedIn Analytics
Key takeaways
| Point | Details |
|---|---|
| Analytics reveal audience and engagement patterns | LinkedIn data shows who views your profile, engages with content, and matches your ideal customer demographics. |
| Moving beyond vanity metrics improves results | Focusing on engagement rates and demographic alignment drives better lead qualification than counting likes. |
| Native and third-party tools complement each other | Combining LinkedIn's dashboard with external platforms maximises insight depth and sales intelligence. |
| Frameworks organise data into actionable strategies | Structuring analytics into audience, content, and engagement pillars guides targeted sales decisions. |
| Data-driven insights generate measurable growth | Systematic analytics application translates directly into higher conversion rates and revenue increases. |
Introduction to LinkedIn analytics for B2B sales
LinkedIn analytics encompass the data LinkedIn collects about your profile visitors, content performance, and audience interactions. For B2B sales teams at UK SMEs, this intelligence is invaluable. LinkedIn remains the dominant professional networking platform in Britain, where decision-makers actively research vendors and solutions.
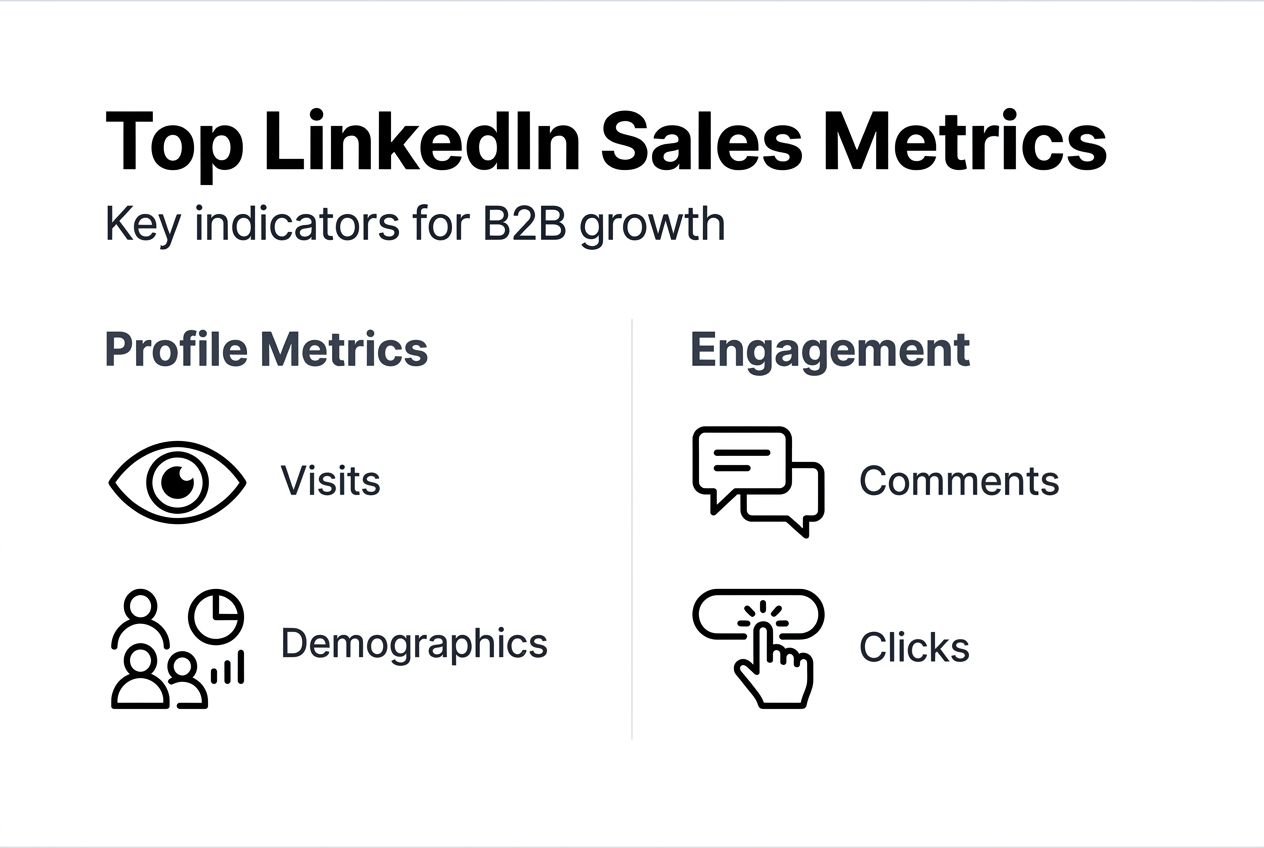
The analytics dashboard tracks three core data types. First, audience demographics reveal industries, job titles, and seniority levels of people viewing your content. Second, engagement metrics measure how users interact with your posts through likes, comments, shares, and click-throughs. Third, conversion data shows profile visits and subsequent actions visitors take.
These metrics matter because they illuminate patterns invisible to casual observation. When LinkedIn's native analytics dashboard shows that senior procurement managers from manufacturing firms visit your profile every Tuesday morning, you've discovered a targeting opportunity. Sales teams who ignore this intelligence waste effort on generic outreach whilst competitors craft precise messaging.
Key data points include:
- Profile visit frequency and visitor job functions
- Content impression counts and engagement rates
- Follower growth trajectories and demographic shifts
- Search appearance data revealing how prospects find you
- Post performance comparisons across topics and formats
Understanding your LinkedIn sales strategy foundation starts with recognising that analytics transform guesswork into strategy. You no longer wonder which prospects engage with your content. The data tells you explicitly, enabling surgical precision in follow-up conversations.
Key LinkedIn analytics metrics for B2B lead generation
Not all LinkedIn metrics deserve equal attention from sales teams. Five core measurements directly impact lead generation effectiveness and deserve daily monitoring.
Profile visits indicate interest levels in your personal or company brand. A spike in visits from a target account signals active research, creating a warm outreach opportunity. Content impressions measure how many users see your posts, establishing reach potential. However, impressions alone don't guarantee engagement or sales relevance.

Engagement rate calculates the percentage of viewers who interact with your content through likes, comments, or shares. This metric reveals content resonance far better than raw impression counts. Demographic insights show the job titles, industries, and company sizes of your audience, validating whether you're reaching decision-makers or irrelevant contacts.
Click-through rates measure how often viewers click links in your posts or profile. High CTRs indicate compelling calls to action and genuine interest. These metrics collectively paint a picture of lead quality rather than mere visibility.
| Metric | Definition | Typical Range | Sales Relevance |
|---|---|---|---|
| Profile visits | Weekly viewers of your profile | 50-500 for active sellers | Indicates brand awareness and interest signals |
| Engagement rate | Interactions divided by impressions | 2-8% for B2B content | Measures content relevance to target audience |
| Demographic match | Percentage fitting ideal customer profile | 40-70% for targeted strategies | Validates targeting accuracy and message fit |
| Click-through rate | Link clicks per impression | 1-3% for professional posts | Shows call-to-action effectiveness and intent |
| Follower growth | New followers per month | 20-200 depending on activity | Reflects expanding influence within target market |
These metrics for sales success require context. A 10% engagement rate means little if your audience consists of students rather than procurement directors. Always filter metrics through the lens of lead quality, not quantity. Sales teams who chase high engagement from irrelevant audiences waste resources building vanity metrics instead of pipeline.
Common misconceptions about LinkedIn analytics
Sales teams frequently misinterpret LinkedIn analytics, leading to misguided strategies and disappointing results. Understanding these pitfalls prevents wasted effort and accelerates sales performance.
The biggest misconception equates likes with sales success. A post receiving 200 likes from junior staff generates zero pipeline if none hold purchasing authority. Profile views similarly mislead when teams celebrate high numbers without checking visitor seniority or industry relevance.
Another error involves treating native LinkedIn analytics as comprehensive. Whilst LinkedIn's dashboard provides valuable baseline data, it lacks advanced filtering and competitor benchmarking. Third-party tools fill gaps by tracking prospect behaviour across multiple touchpoints and revealing content performance patterns LinkedIn's interface misses.
Many teams also commit the sin of passive analytics consumption. They review weekly reports without translating insights into action. Data only creates value when it changes behaviour. If analytics reveal that video content generates 3x more qualified leads than text posts, yet your strategy doesn't shift toward video, you've wasted the insight.
Key misconceptions to avoid:
- Assuming all engagement indicates buying interest regardless of job title
- Believing high follower counts automatically generate qualified leads
- Treating analytics as retrospective reports rather than forward-looking guides
- Ignoring the qualitative context behind quantitative metrics
- Expecting instant results without sustained strategic adjustments
"Analytics without action is just expensive spectating. The teams who win on LinkedIn treat data as a continuous feedback loop that reshapes every aspect of their sales approach."
The solution requires marrying quantitative metrics with qualitative intelligence. When analytics show increased engagement from a target account, sales teams should investigate why. Perhaps a recent post addressed a pain point that prospect faces. That qualitative context transforms a metric into a conversation starter worth far more than the engagement number itself.
Framework for leveraging LinkedIn analytics insights
A structured approach prevents analytics overwhelm and ensures systematic improvement. The three-pillar framework organises LinkedIn data into actionable categories that directly enhance sales outcomes.
The first pillar focuses on audience insights. This encompasses demographic data, growth patterns, and follower quality metrics. Sales teams analyse who engages with their content and whether those individuals match ideal customer profiles. When misalignment appears, content strategy adjusts to attract the right decision-makers.
The second pillar examines content performance. Which post formats drive engagement? What topics resonate with target audiences? How do publishing times affect visibility? This pillar reveals the messaging and delivery methods that move prospects through the sales funnel most efficiently.
The third pillar tracks engagement metrics that signal buying intent. Not all interactions hold equal weight. A comment from a CFO at a target account matters infinitely more than ten likes from unrelated connections. This pillar prioritises engagement by prospect value, enabling sales teams to focus follow-up efforts where they'll generate maximum return.
| Pillar | Data Types | Examples | Sales Application |
|---|---|---|---|
| Audience insights | Demographics, industries, seniority | 65% of followers are operations directors in manufacturing | Refine messaging to address operational efficiency challenges |
| Content performance | Engagement rates, format effectiveness | Video posts generate 4x more comments than text | Increase video content production and reduce text-only posts |
| Engagement metrics | Interaction quality, prospect alignment | Target account employees commenting on recent posts | Prioritise outreach to engaged prospects whilst interest peaks |
Pro Tip: Combine quantitative analytics with qualitative feedback by messaging engaged prospects to ask what resonated. Their responses reveal messaging nuances that raw data cannot capture, refining your value proposition for future outreach.
This framework transforms scattered data points into a coherent sales intelligence system. Rather than drowning in metrics, teams focus on the three areas that most directly impact pipeline generation. Weekly reviews of each pillar identify trends early, allowing rapid strategy pivots that capitalise on emerging opportunities or address declining performance before it damages results.
Real-world examples: LinkedIn analytics driving sales growth
UK SMEs applying LinkedIn analytics strategically achieve measurable sales improvements. These case studies demonstrate concrete applications and outcomes.
A Manchester-based software firm analysed their LinkedIn analytics and discovered that posts explaining technical implementation details generated 42% higher engagement from IT directors than generic product announcements. They shifted their content strategy accordingly. Within three months, qualified lead volume increased by 38%, and sales conversations became more technical and solution-focused from the outset.
A London consultancy examined audience activity patterns in their analytics dashboard. Data revealed that their target prospects engaged most actively between 7-9am on Tuesday and Wednesday mornings. By scheduling posts and outreach during these windows, they increased profile visits by 56% and booked 23% more discovery calls without increasing content volume.
A Birmingham manufacturing supplier integrated LinkedIn analytics with their CRM system, creating a lead scoring model that weighted LinkedIn engagement alongside traditional signals. Sales reps prioritised prospects who viewed their profile multiple times or engaged with product-specific content. This approach increased conversion rates by 31% whilst reducing time spent on cold outreach by 40%.
Steps these organisations followed:
- Established baseline metrics across audience, content, and engagement pillars
- Identified the single biggest gap between current performance and desired outcomes
- Formulated a hypothesis about what change would close that gap
- Implemented the change whilst maintaining consistent measurement
- Reviewed results after 30 days and either scaled the successful change or tested a new approach
- Repeated the cycle continuously, compounding incremental improvements
These examples share common threads. Each organisation treated analytics as a strategic asset rather than a reporting obligation. They acted on insights quickly, tested hypotheses rigorously, and maintained discipline in measurement. None achieved overnight transformation, but systematic application of analytics-driven improvements generated substantial results within quarters, not years.
Practical tips for optimising LinkedIn sales performance using analytics
Translating analytics insights into daily sales actions requires specific techniques and tools. These practical approaches help UK SME sales teams extract maximum value from LinkedIn data.
Start by selecting the right analytics tools for your needs. LinkedIn's native dashboard provides solid baseline metrics at no cost. It tracks profile views, post engagement, and follower demographics adequately for teams just beginning analytics application. However, third-party LinkedIn analytics tools can boost lead discovery rates by 15-25% over native analytics through advanced filtering, competitor benchmarking, and cross-platform integration.
Scheduling content based on analytics transforms posting from guesswork into science. Review when your target audience is most active, then schedule posts 30-60 minutes before peak activity windows. This timing maximises initial engagement, which LinkedIn's algorithm rewards with broader distribution.
Integrate LinkedIn analytics with your CRM to create a unified view of prospect behaviour. When a target account employee views your profile, that signal should trigger in your CRM, prompting timely outreach. Similarly, tracking which prospects engage with specific content topics arms sales reps with conversation starters grounded in demonstrated interest rather than assumptions.
Common analytics pitfalls to avoid:
- Changing strategies too frequently before gathering sufficient data
- Comparing your metrics to irrelevant benchmarks from different industries
- Ignoring negative trends until they become crises
- Failing to segment analytics by audience type or content category
- Treating analytics review as a monthly obligation rather than a weekly discipline
Pro Tip: Regularly review and adapt strategies based on evolving analytics trends because audience preferences shift quarterly. What worked brilliantly in January may underperform by April as market conditions, competitive dynamics, and prospect priorities change.
Establish a weekly analytics review routine. Spend 30 minutes examining the three framework pillars, noting significant changes and emerging patterns. Monthly, conduct deeper analysis identifying longer-term trends and strategic opportunities. This rhythm keeps your LinkedIn sales strategy responsive without becoming reactive.
The teams achieving best results treat analytics as a continuous improvement engine. They celebrate wins, learn from disappointments, and maintain relentless focus on the metrics that directly drive pipeline growth. This discipline, more than any single tactic, separates analytics leaders from those who merely collect data.
Enhance your LinkedIn sales results with IN Social
Understanding LinkedIn analytics is one thing. Applying them consistently to drive measurable sales growth requires expertise and dedicated effort. That's where IN Social's managed LinkedIn services help UK SMEs bridge the gap between knowledge and results.
Our team combines deep LinkedIn analytics expertise with proven sales methodologies tailored for B2B markets. We handle the heavy lifting of data analysis, strategy formulation, and content optimisation whilst you focus on closing deals.
Join the IN Social Sales Club to access ongoing training, peer support, and expert guidance that keeps your LinkedIn sales approach current and effective. We help you avoid common pitfalls and accelerate results through battle-tested frameworks.
Curious whether LinkedIn fits your specific sales context? Take our LinkedIn sales strategy assessment to discover customised recommendations for leveraging analytics in your market. Let's transform your LinkedIn data into qualified leads and closed revenue.
Frequently asked questions about the role of LinkedIn analytics
What are the most important LinkedIn analytics metrics for B2B sales teams?
Profile visits from target account employees, engagement rates on content addressing specific pain points, and demographic alignment between your audience and ideal customer profile matter most. These metrics directly indicate prospect interest and targeting accuracy, unlike vanity metrics that measure visibility without qualifying intent or fit.
How can LinkedIn analytics improve lead qualification and prioritisation?
Analytics reveal which prospects engage repeatedly with your content, visit your profile multiple times, or interact with solution-specific posts. These behaviour signals indicate genuine interest and research activity, enabling sales teams to prioritise warm prospects over cold contacts. Integrating this data with CRM systems creates sophisticated lead scoring that focuses effort where conversion probability is highest.
Are third-party LinkedIn analytics tools necessary for SMEs?
Native LinkedIn analytics suffice for basic monitoring, but third-party tools become valuable as sales sophistication grows. They provide competitor benchmarking, advanced audience segmentation, and cross-platform tracking that LinkedIn's dashboard lacks. SMEs serious about LinkedIn as a primary lead generation channel typically see ROI from third-party tools within 3-6 months through improved targeting efficiency.
What common mistakes should be avoided when interpreting LinkedIn analytics?
The biggest error is treating all engagement equally regardless of prospect quality. A like from a junior assistant doesn't equal a comment from a procurement director. Also avoid changing strategies too quickly before gathering sufficient data, typically requiring 4-6 weeks of consistent approach. Finally, never review analytics in isolation from business context like seasonal buying patterns or competitive activity that influences metrics independently of your actions.
How often should sales teams review LinkedIn analytics data?
Weekly reviews of core metrics maintain responsiveness without overreacting to short-term fluctuations. Monthly deep dives identify strategic trends requiring larger adjustments. Daily checks make sense only for teams running active campaigns with significant budget at stake. The rhythm matters less than consistency and translating insights into concrete action rather than passive observation.